DevTools / Enterprise UX
Dashboards and Data Explorers
Enabling developers to act on code quality data
Outcome
Shipped a configurable dashboard and data-explorer system that made code quality data genuinely actionable for developers
Problem
Parasoft's Development Testing Platform (DTP) collected vast amounts of code quality data, but its dashboards and reports were difficult for developers to use. The core challenge was translating complex, raw data into a clear, actionable UI that helped users quickly identify issues and take action — increasing engagement and the platform's overall value.
Process
- 1
Led discovery workshops with product managers and engineering teams to define user needs, map business use cases, and identify core pain points; researched industry design and interaction models to inform strategy
- 2
Translated discovery insights into flows, sketches, and rough concepts for new dashboards and data explorers, iterating with stakeholders to align and refine
- 3
Built interactive prototypes to test complex interaction models and demonstrate the user journey, reviewed with executive stakeholders to secure buy-in and funding
Result
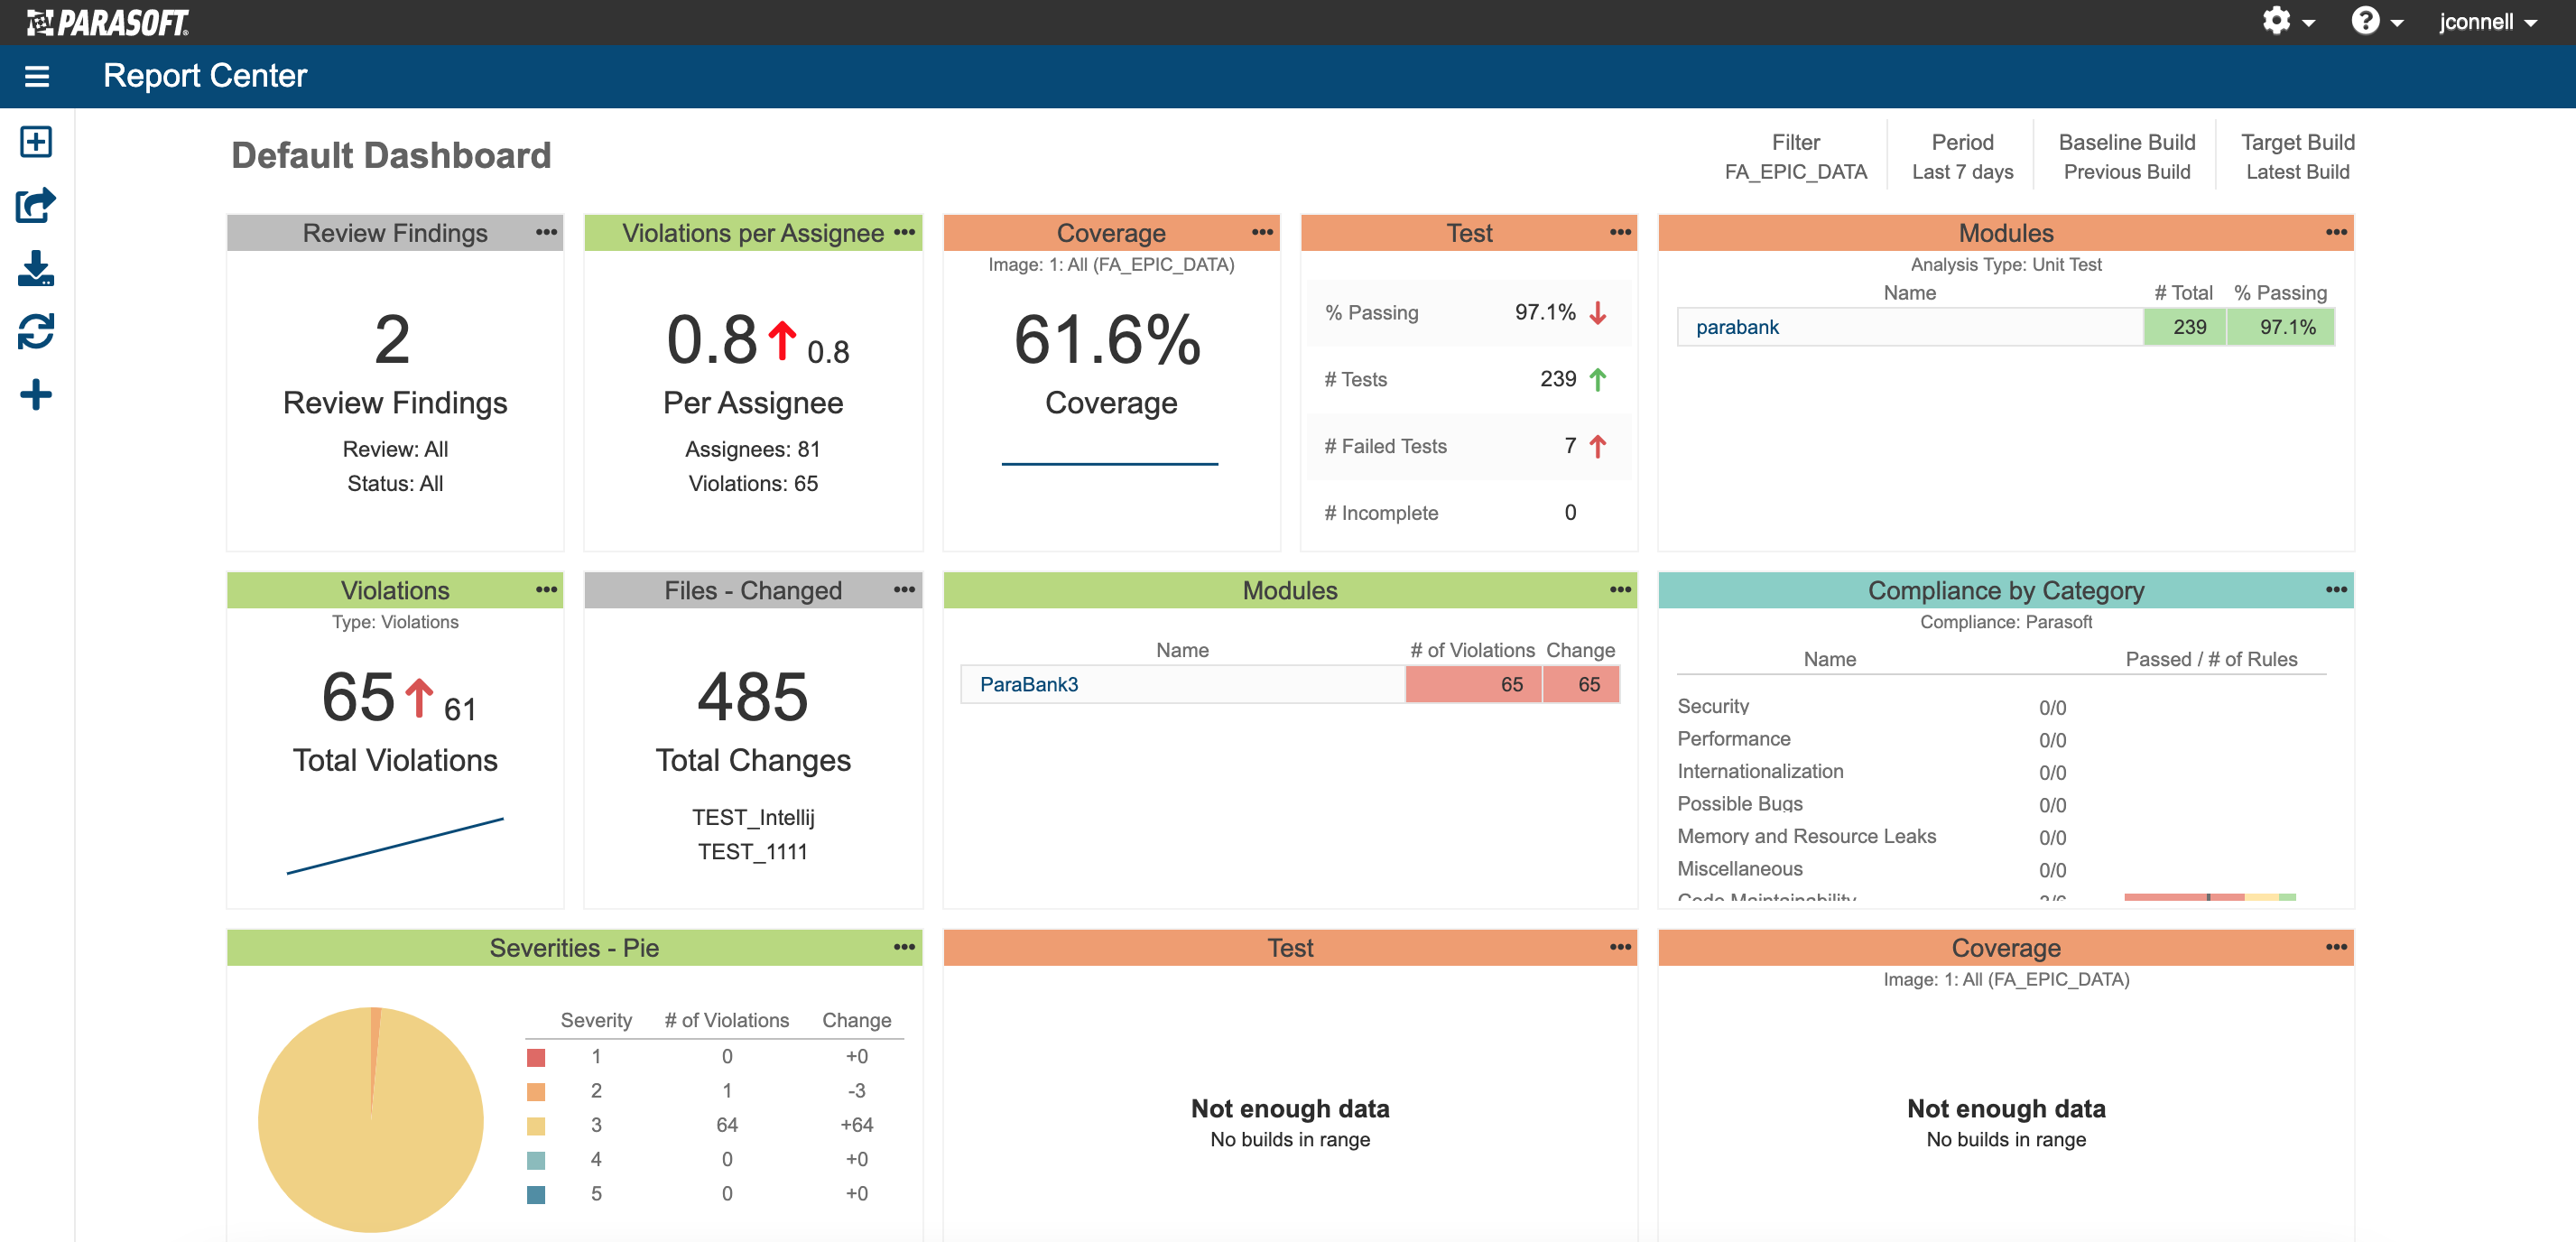
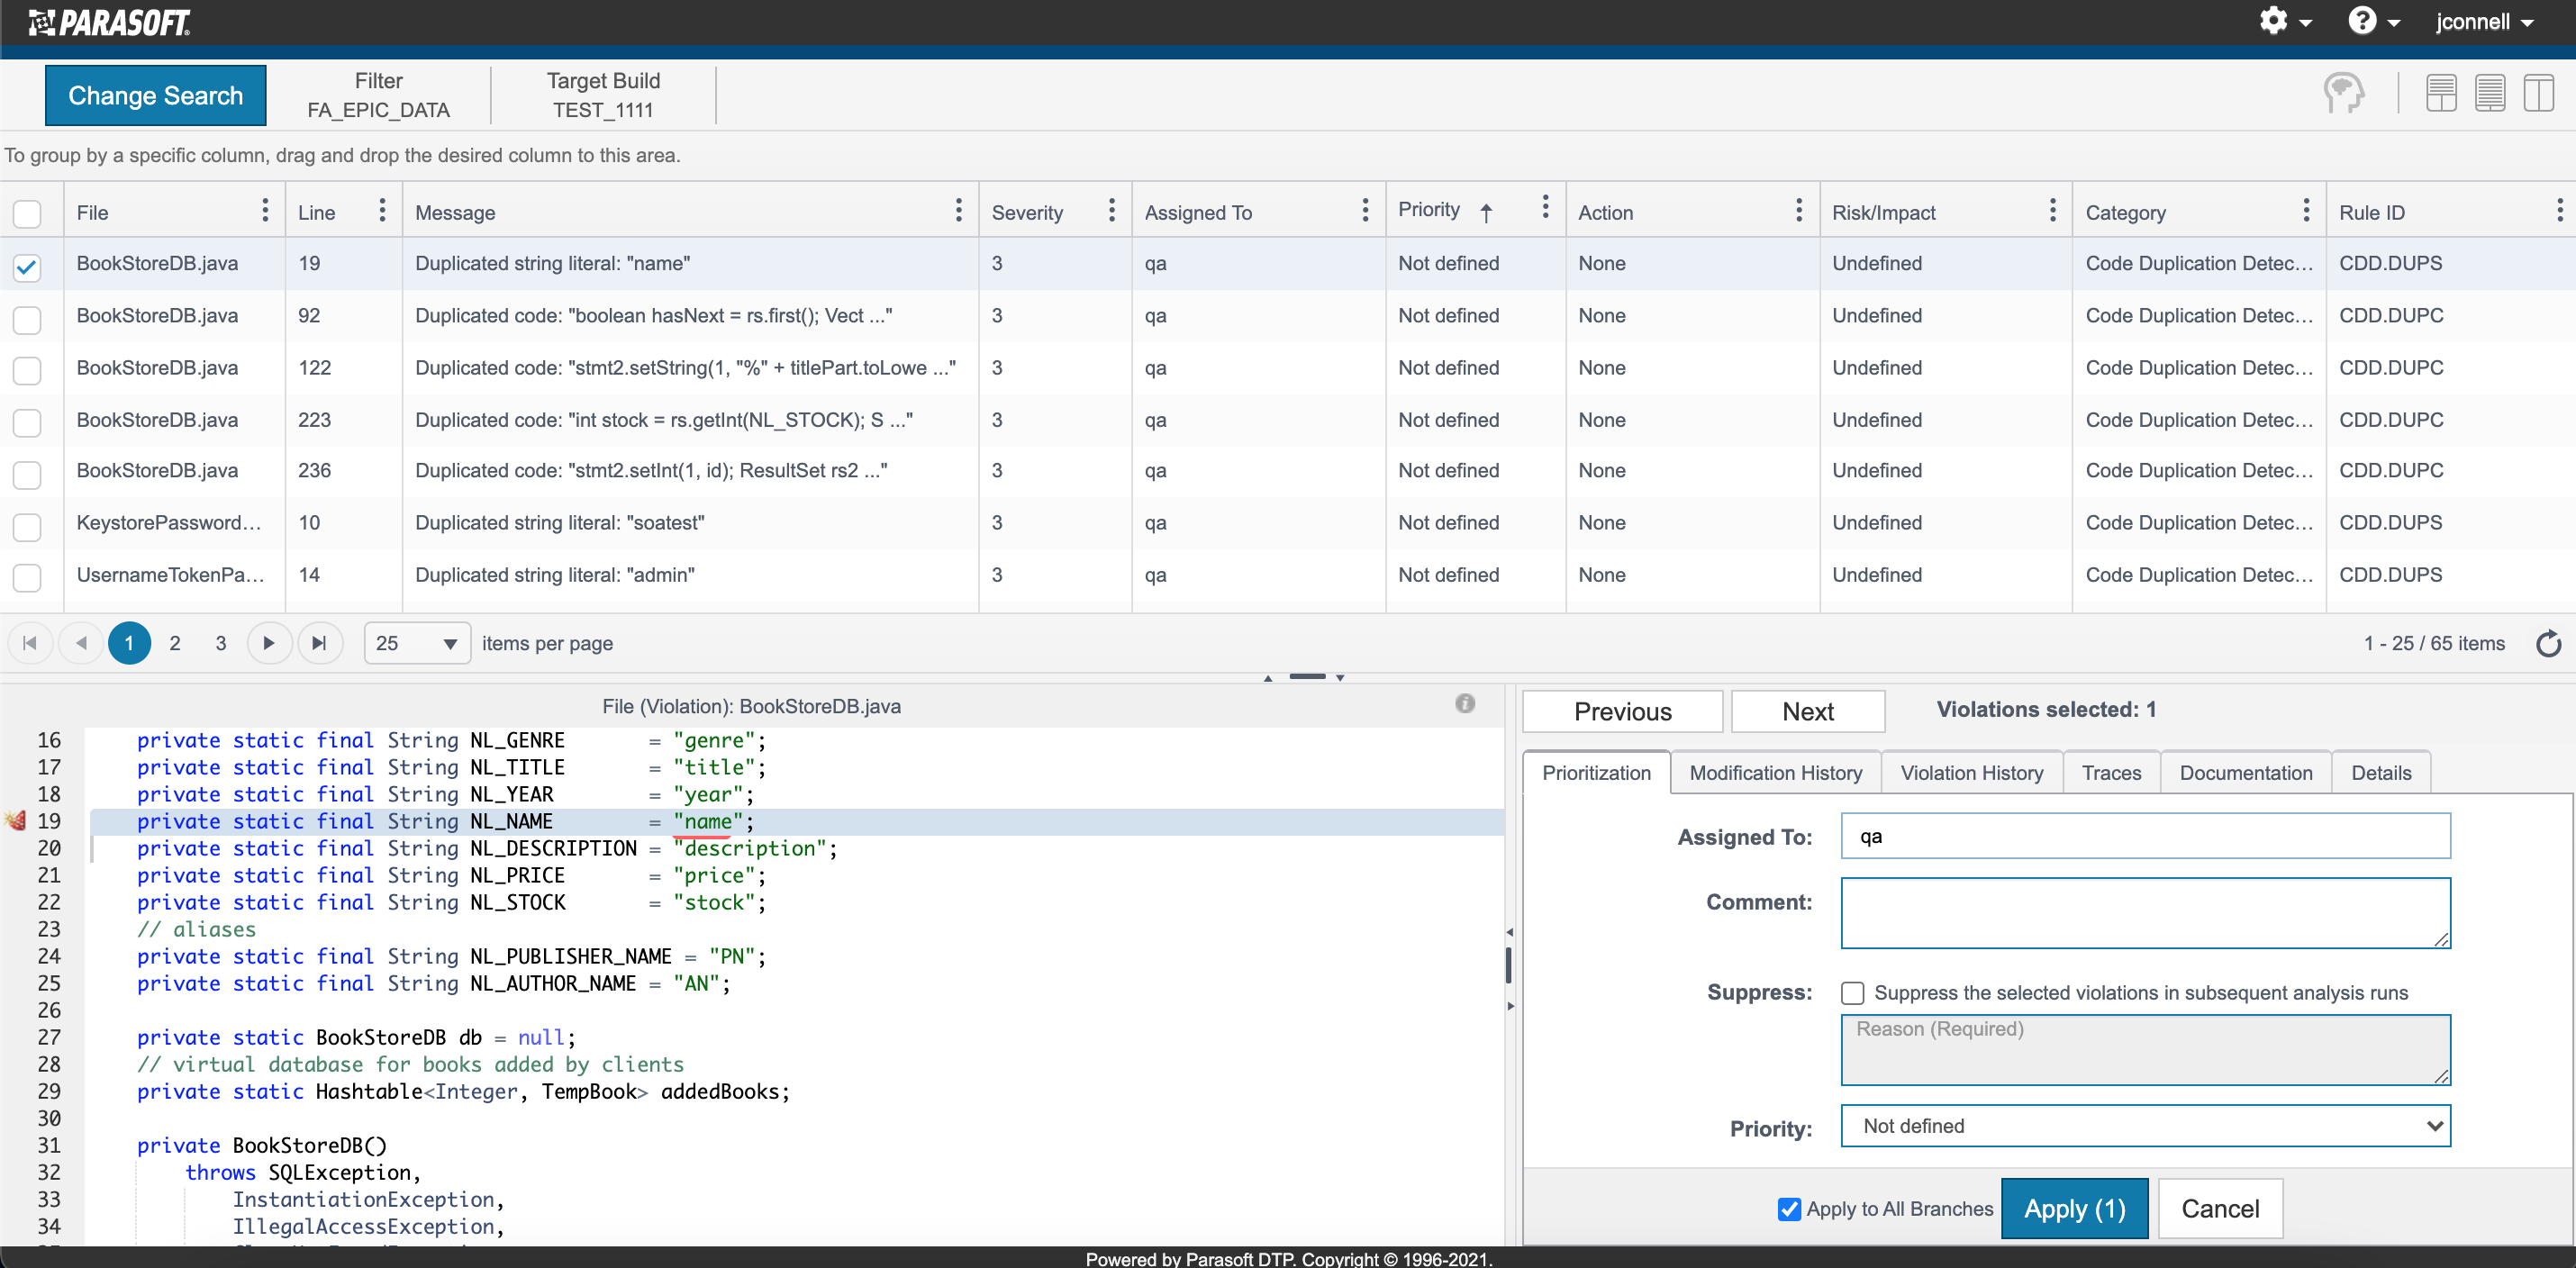
Designed a configurable dashboard system providing at-a-glance insights with role-based customization, plus data "explorer" pages with powerful filtering and drill-down — letting users move from high-level trends to code-level detail. These changes directly addressed the need for actionable feedback, making the data useful and increasing the likelihood that users would act on it to improve code quality.